
Visualizing Oregon and Washington ZIP Code Demographics Using Census Data
The geographic and demographic landscape of Oregon and Washington is as varied as its geography. By visualizing data from the U.S. Census Bureau, we can better understand the socioeconomic characteristics of various regions. The data presented here offers insights into household income, family structures, and more, across ZIP codes in Oregon and Washington. This post discusses the data, its origins, and how it’s visualized using a web app built with Python’s Dash framework and Plotly for interactive geographic visualizations.
9/5/20244 min read
Visualizing Oregon and Washington ZIP Code Demographics Using Census Data
The geographic and demographic landscape of Oregon and Washington is as varied as its geography. By visualizing data from the U.S. Census Bureau, we can better understand the socioeconomic characteristics of various regions. The data presented here offers insights into household income, family structures, and more, across ZIP codes in Oregon and Washington. This post discusses the data, its origins, and how it’s visualized using a web app built with Python’s Dash framework and Plotly for interactive geographic visualizations.
Data Sources
The app leverages several critical datasets, primarily drawn from the U.S. Census Bureau’s American Community Survey (ACS), one of the most comprehensive public data sources in the U.S. The ACS provides annual estimates on a wide range of demographic, economic, housing, and social characteristics. In this project, we use the following types of data for each ZIP code across Oregon and Washington:
1. Household Income:
• Median Household Income: The income level at which half of households earn more and half earn less.
• Average Household Income: The mean household income, providing insights into wealth distribution.
• Per Capita Income: The average income per person within a ZIP code, offering a more granular view of wealth distribution.
2. Housing Units:
• Renter Occupied Units: The total number of housing units occupied by renters.
• Owner Occupied Units: The number of housing units that are owned by the occupants.
• Median Value of Owner-Occupied Units: An important measure for understanding real estate market conditions across the region.
3. Family Structures:
• Married Couple Families: The number of households where the primary residents are married couples.
• Single Parent Families: The number of households headed by a single parent, often used to understand family dynamics and economic challenges in an area.
4. Population Density: This metric gives insights into how densely populated an area is, calculated as the number of people per square mile.
5. Unemployment Percentage: A critical economic indicator that shows the percentage of the labor force that is unemployed and actively seeking work.
6. Age Distribution:
• Households Under 25 Years Old, 25 to 44, 45 to 64, and 65+: These provide insights into the age structure of residents in the ZIP codes, giving a sense of generational differences across regions.
7. Race and Ethnicity:
• White Population Percentage
• Hispanic Population Percentage: These metrics provide insights into the racial and ethnic diversity across ZIP codes.
8. Educational Attainment:
• High School Graduation Rates
• Bachelor’s Degree Rates: These are key metrics for understanding the educational composition of communities.
Visualizing the Data with Dash and Plotly
Interactive Mapping with Choropleth Maps
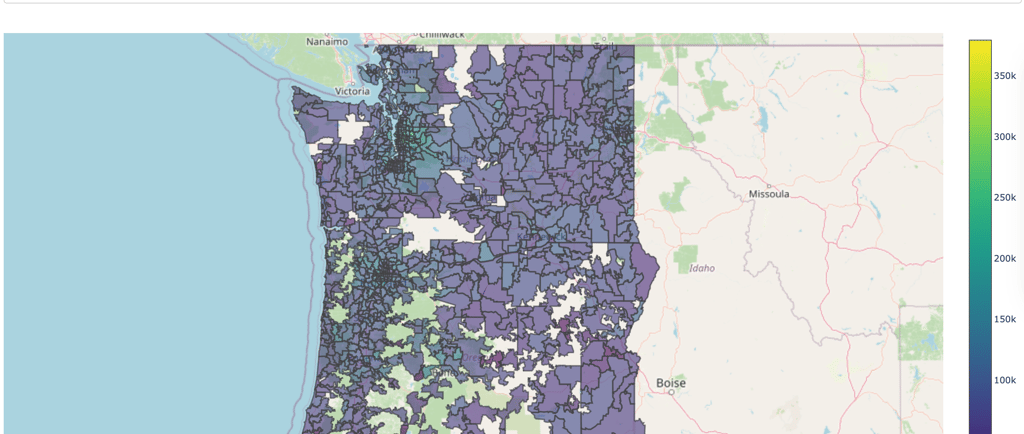
To make the data more accessible and intuitive, we use Choropleth maps—a powerful visualization technique where areas are shaded according to the value of a variable. The color gradient represents the data’s intensity (e.g., income levels, household sizes), with darker shades indicating higher values and lighter shades indicating lower values.
The app leverages Plotly’s Choroplethmapbox feature to plot ZIP codes across Oregon and Washington. By using latitude and longitude from the ZIP code boundaries, each geographic region is filled with colors corresponding to the selected demographic variable.
User Interaction
The app is built using Dash, a web framework for Python that facilitates building data-driven web apps with highly interactive visualizations. Dash’s powerful callback mechanism is used here to dynamically update the map based on user input.
• Dropdown Input: Users can choose which demographic variable they want to visualize, such as Median Household Income, Per Capita Income, or Unemployment Percentage. The dropdown is populated with options representing these demographic metrics.
• Hover Text: As users hover over a ZIP code, detailed information about that area’s demographics, such as income levels, family structures, and educational attainment, appears. The hover text provides a snapshot of various characteristics of each ZIP code.
Customization of Hover Information
The app goes a step further by customizing hover data for each ZIP code. The customdata parameter is used to pass detailed data about each ZIP code to the map. When users hover over a region, they see a well-formatted list of statistics, including:
• Income Levels: Median and average household incomes.
• Housing: The number of renter and owner-occupied units, as well as the median value of homes.
• Family Structure: Information on married couple families and single-parent families.
• Unemployment and Population Density: Data on economic health and how densely populated each ZIP code is.
• Race, Ethnicity, and Education: Information on the racial composition and education levels within each ZIP code.
This customization helps to provide context to the data and allows users to explore different variables dynamically.
Geographic Scope
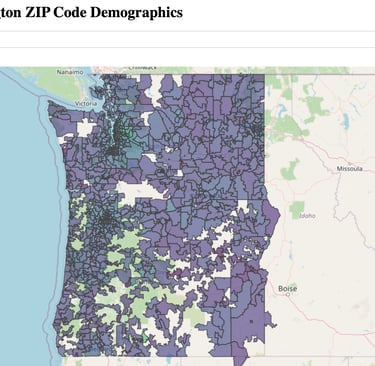
The app focuses on ZIP codes in Oregon and Washington, two states with unique and diverse demographics. From rural farming areas to dense urban centers like Seattle and Portland, the app provides a tool to explore how different regions compare on key socioeconomic metrics. Whether you’re interested in understanding income inequality, the concentration of certain racial groups, or housing trends, this app offers a visual and interactive way to explore these patterns.
Using the App: Key Insights
• Income Inequality: By switching between median and average household incomes, you can see the disparities between areas with more concentrated wealth (e.g., high average income but lower median income) and those with more uniform wealth distribution.
• Urban vs. Rural: Population density and homeownership patterns offer a stark contrast between urban centers like Portland and Seattle and the more rural ZIP codes that dominate eastern Washington and Oregon.
• Family Structures and Education: The data can help identify areas where single-parent families are more prevalent or where educational attainment is lower, potentially helping to focus resources and support.
Conclusion
This web app offers a dynamic way to explore the demographics of Oregon and Washington at the ZIP code level. By leveraging open data from the U.S. Census Bureau and modern web development tools like Dash and Plotly, we’ve created an intuitive platform to visualize key metrics such as income, housing, family structure, race, and education. The ability to dynamically switch between different metrics makes this tool versatile and useful for researchers, policymakers, and anyone interested in the demographic trends shaping these two states.
By blending census data with interactive visualizations, this app turns complex datasets into insights that are easy to explore and understand, fostering a deeper understanding of regional demographic trends.